Data visualisations
-
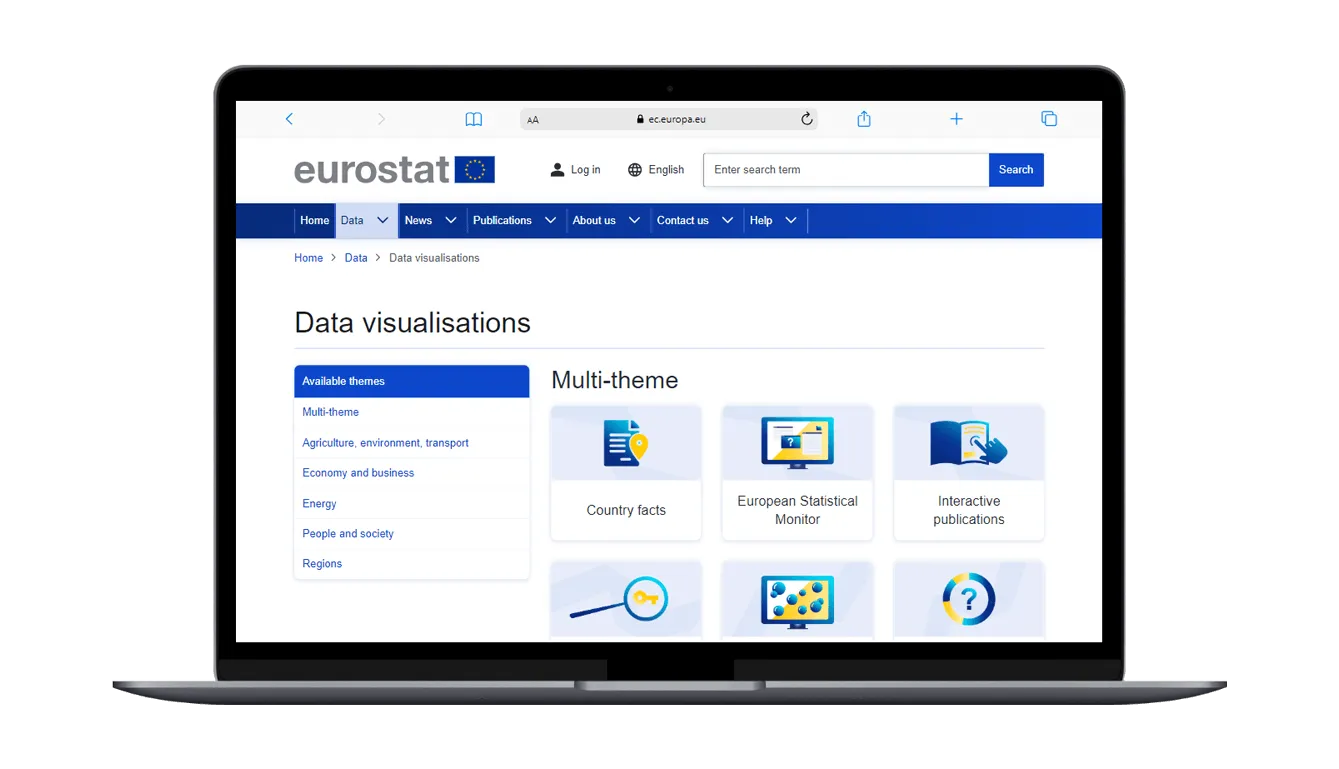
Eurostat’s data visualisations
Eurostat's set of interactive publications and visualisation tools.
-
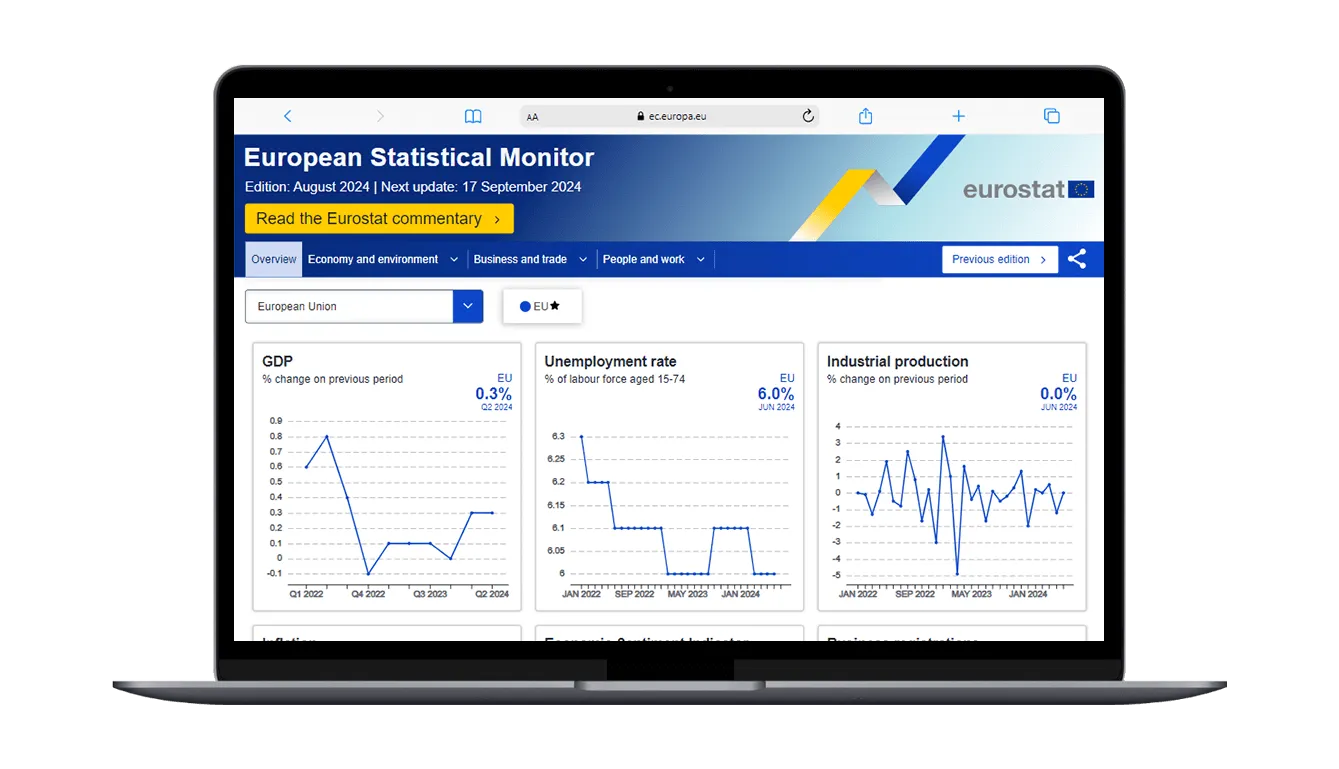
European Statistical Monitor
Eurostat’s dashboard of short-term socio-economic indicators for EU countries.
-
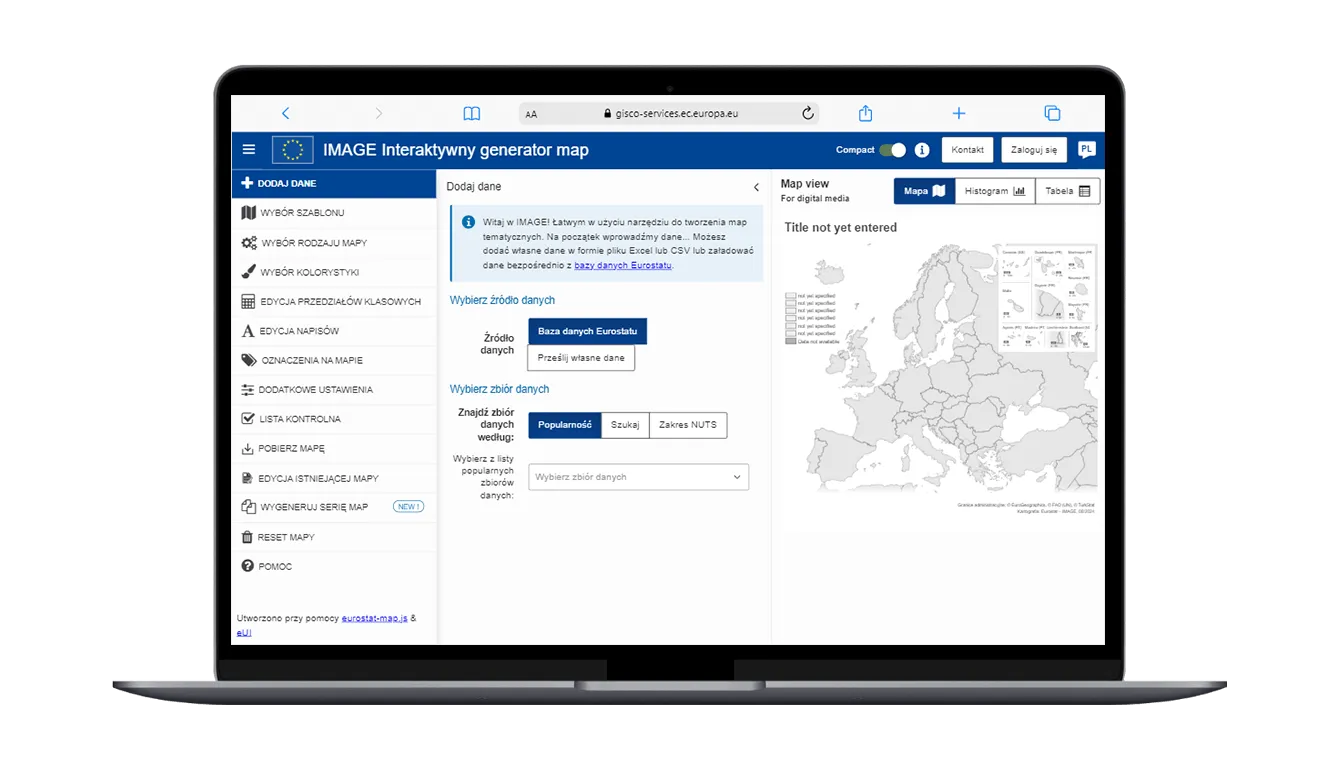
IMAGE Interaktywny generator map
Statistical mapping tool based on Eurostat’s data or on upload of own data.
-
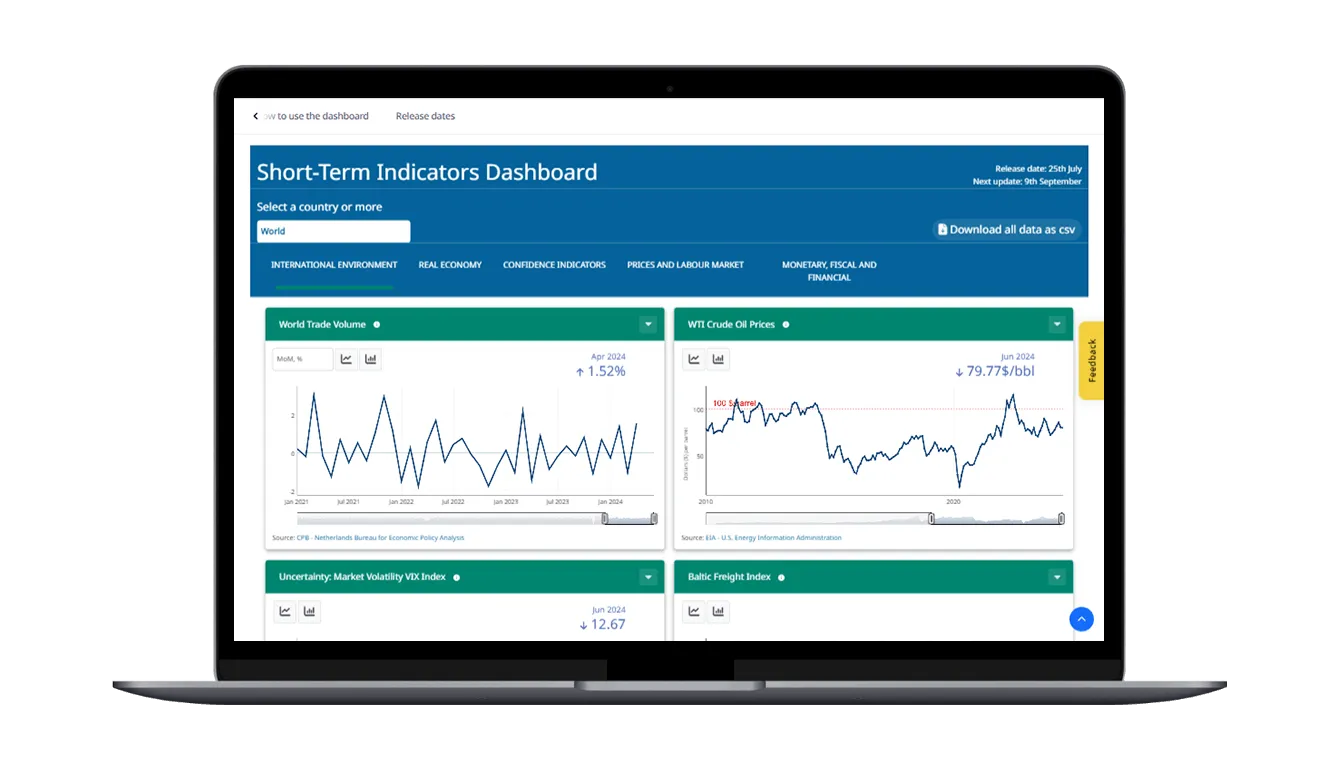
OECD Short-Term Indicators Dashboard
OECD’s dashboard of short-term macroeconomic indicators for G20 countries and selected regional groupings.
-
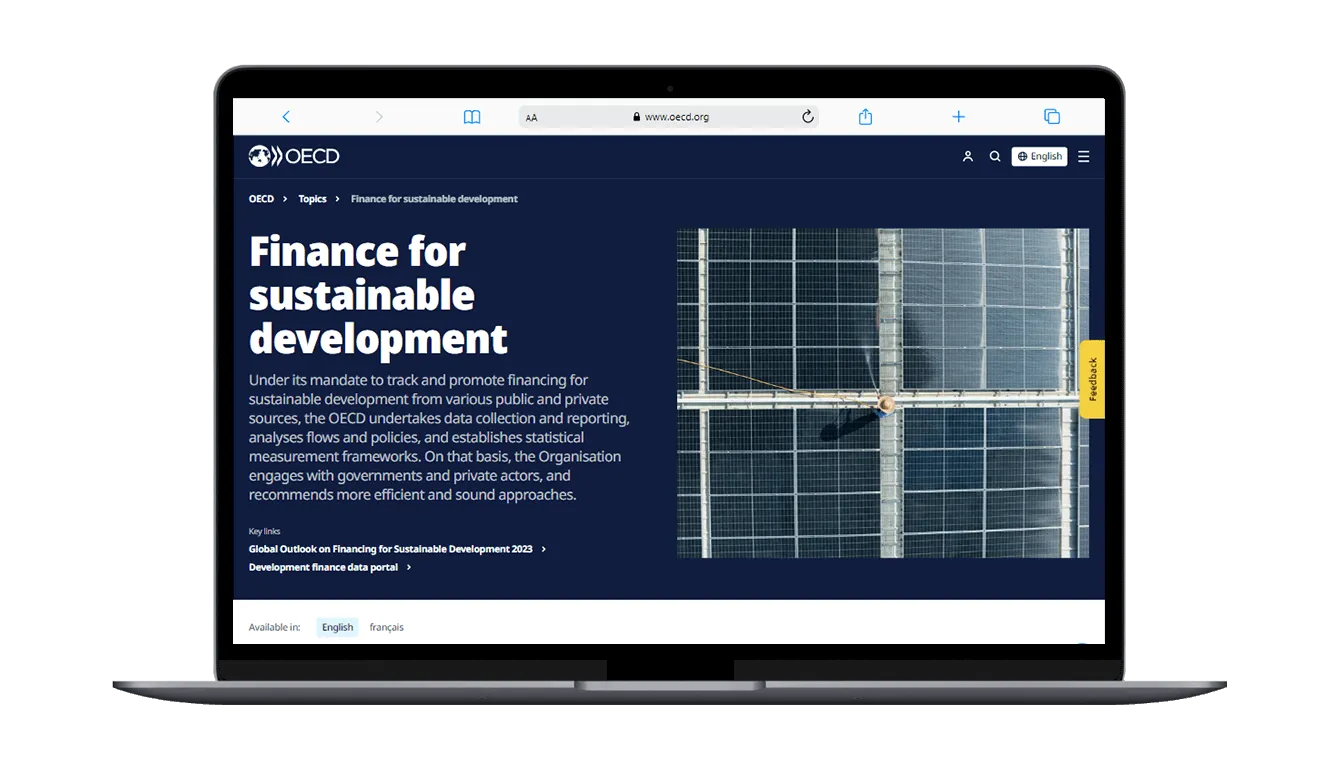
OECD’s Data Visualisation Lab
Interactive graphics with data on financing sustainable development.
-
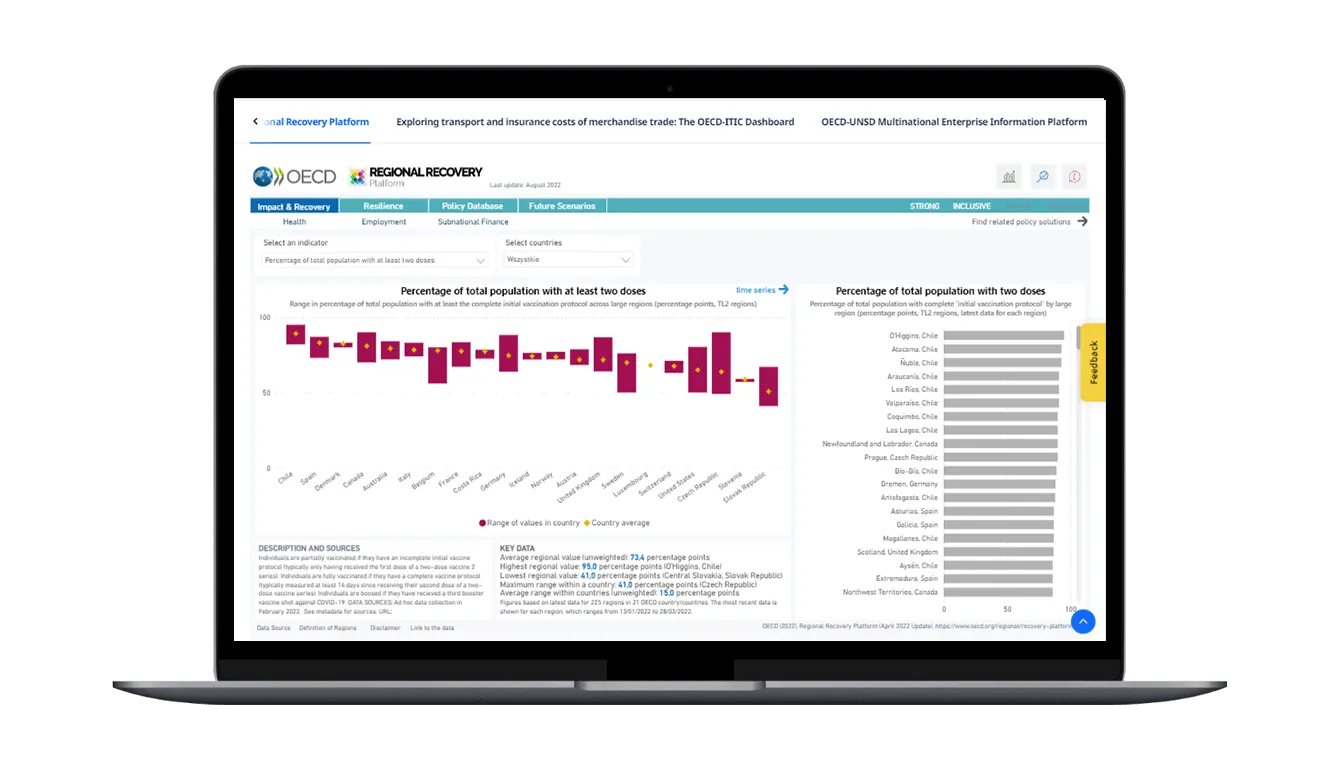
OECD Regional Recovery Platform
Platform monitoring the economic recovery of OECD countries and their regions after the COVID-19 crisis.
-
IMF Data Mapper
Interactive world maps with IMF economic and financial data.
-
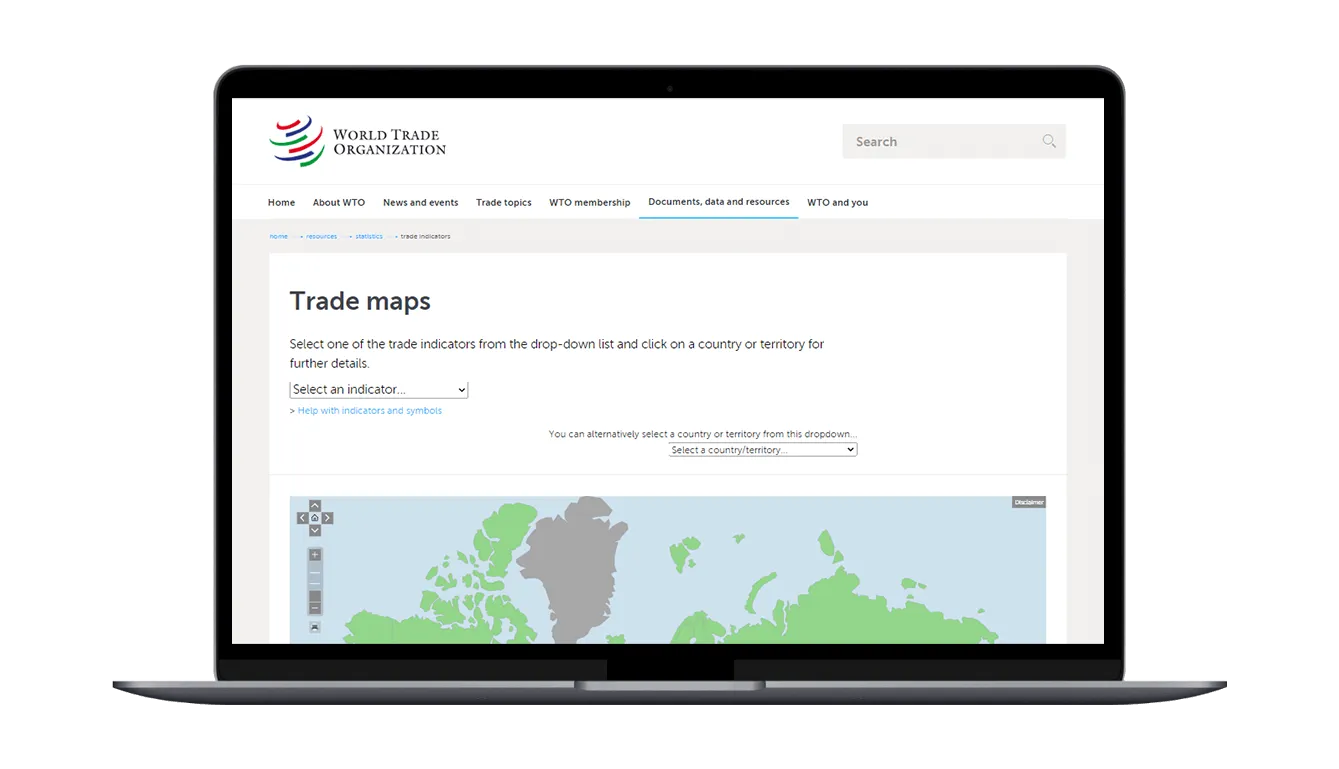
WTO – Trade Maps
Interactive WTO maps for comparing international trade data.
-
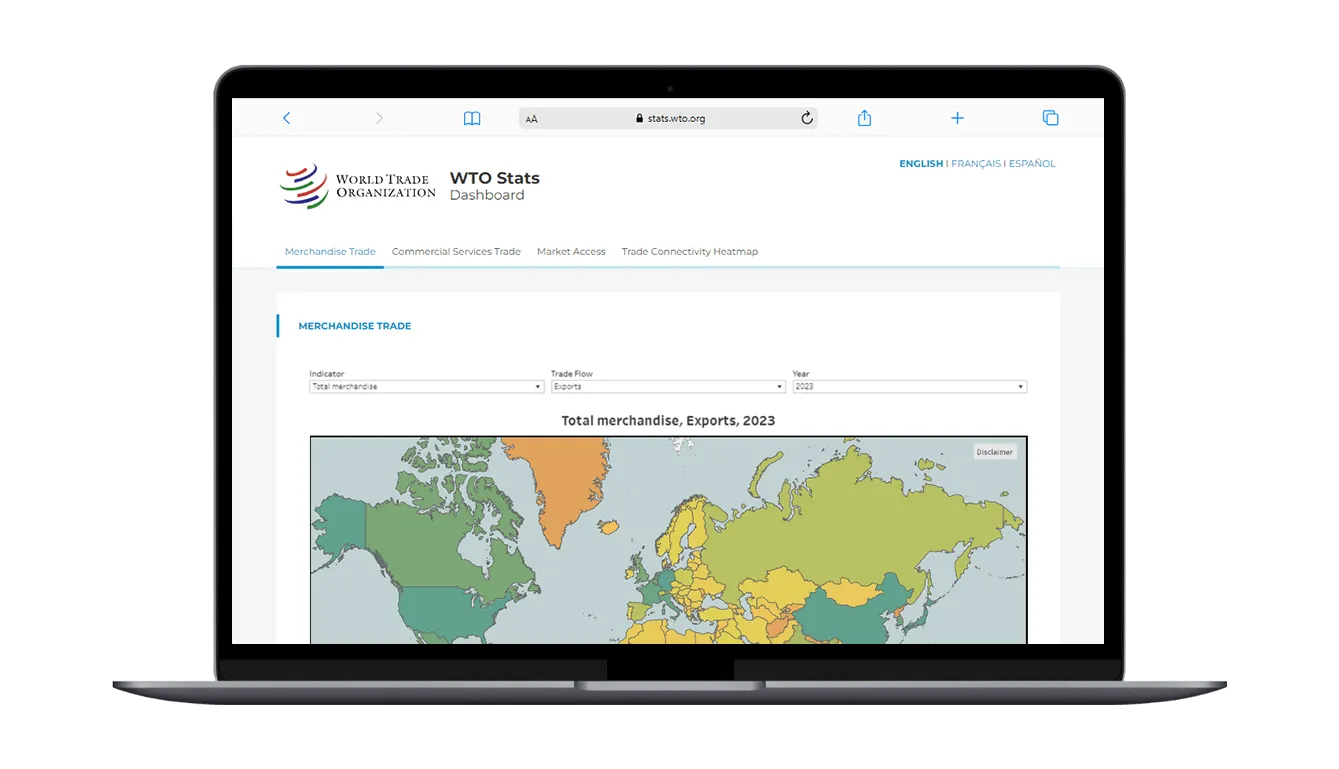
WTO Stats Dashboard
Interactive WTO dashboard monitoring trade in goods, commercial services and market access.
-
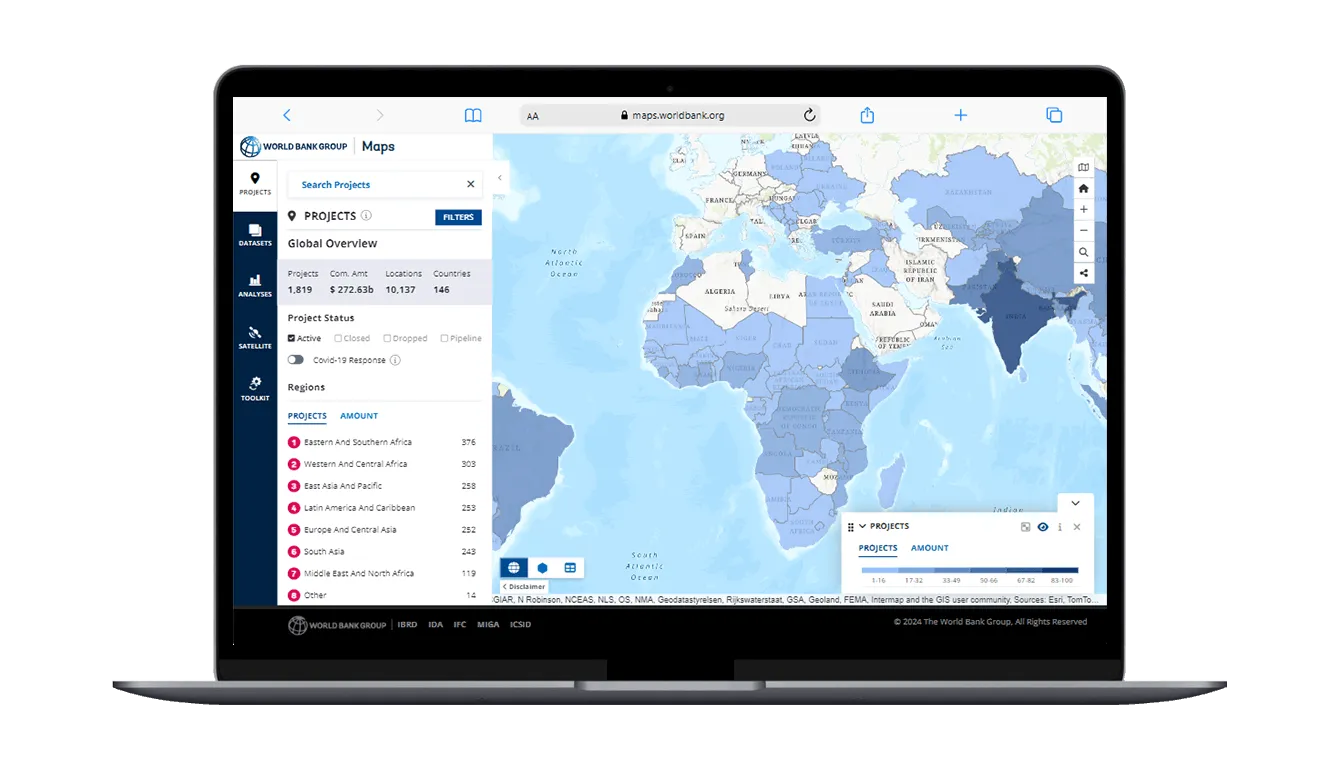
World Bank Maps
Interactive map created by combining Google Maps with World Bank data.
-
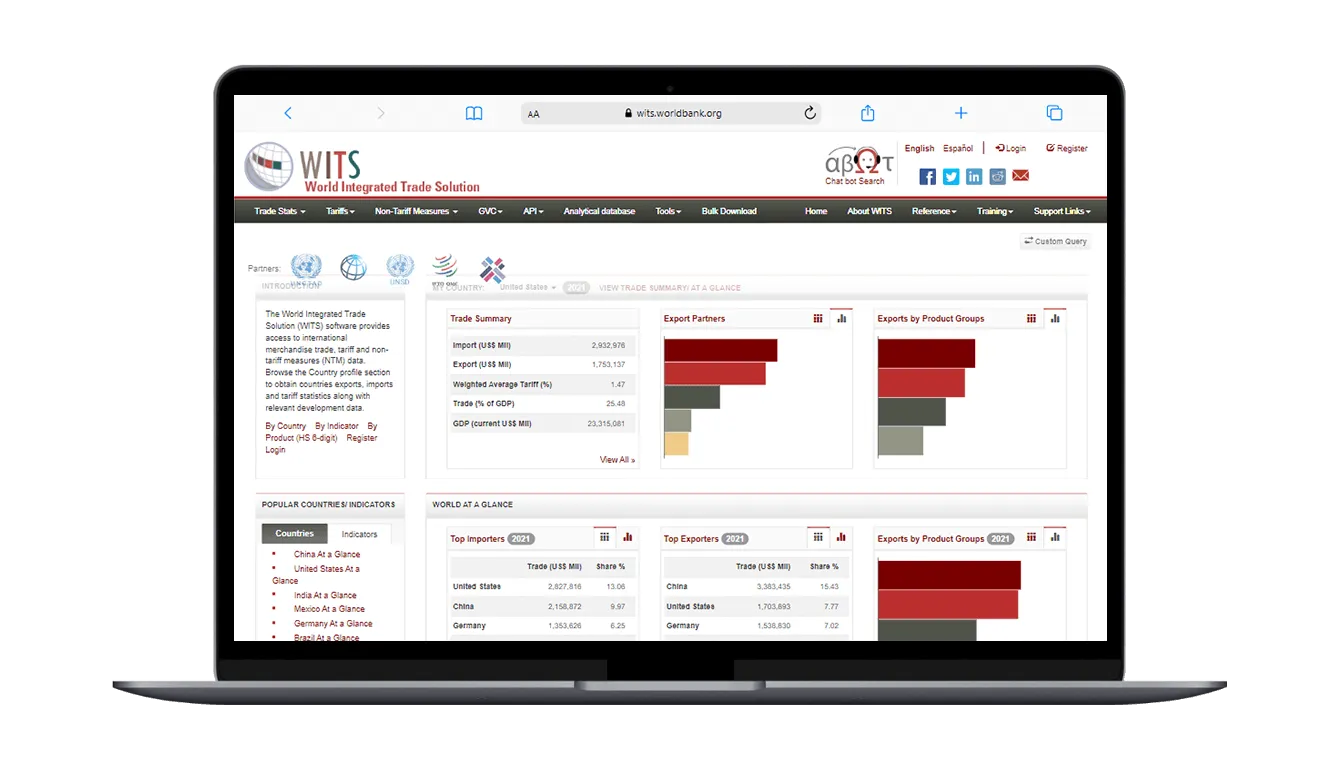
WITS – Trade Data Visualization
World Bank visualisation tool with international merchandise trade, tariff and non-tariff measures data.
-

FAO Interactives
FAO multimedia resources presenting data in the form of digital storytelling.